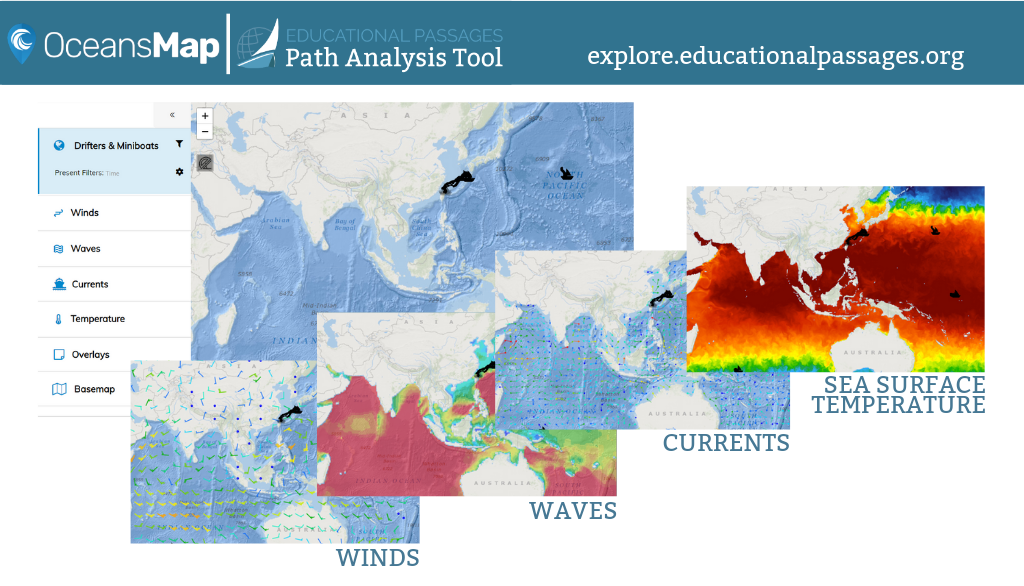
 The Educational Passages Path Analysis Tool allows users to explore and analyze miniboat and drifter tracks with layers of winds, waves, currents, and temperature. Users can span the world ocean from the Atlantic to Pacific, explore the data behind each point, calculate distance using a measuring tool, and explain phenomenon behind the tracks. The tool is developed and maintained by the RPS Ocean Science Team. Tracks are from Educational Passages (www.educationalpassages.org) and Student Drifter (www.studentdrifters.org) programs. Click the link to access the tool:
explore.educationalpassages.org
User Guide
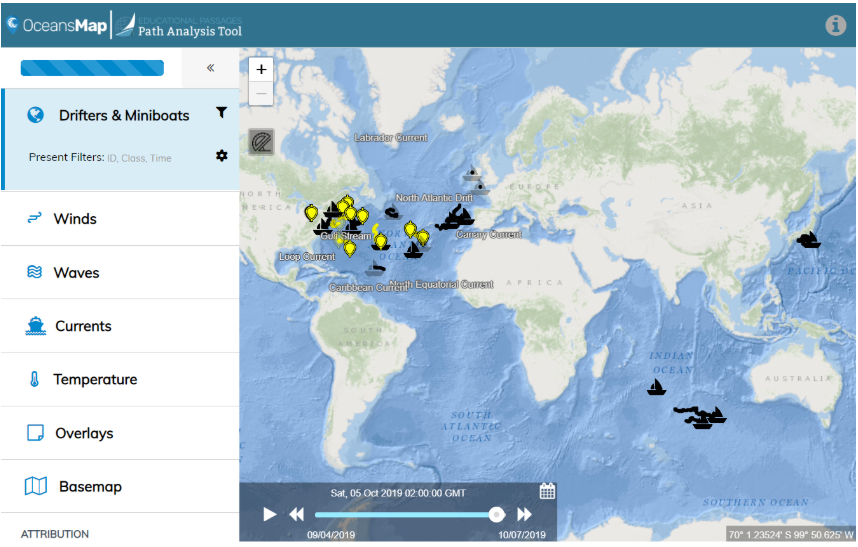
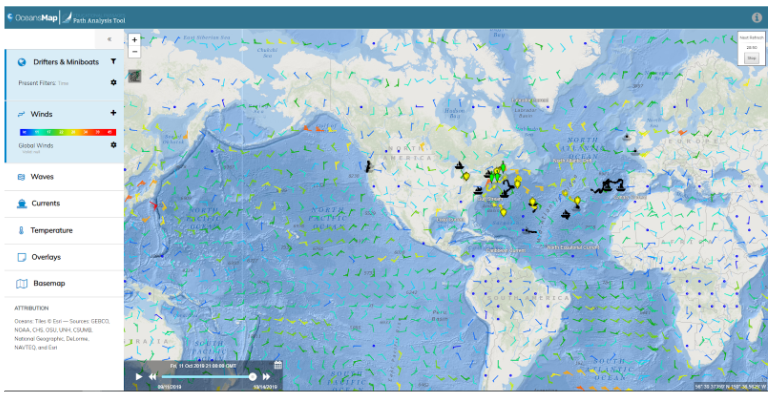
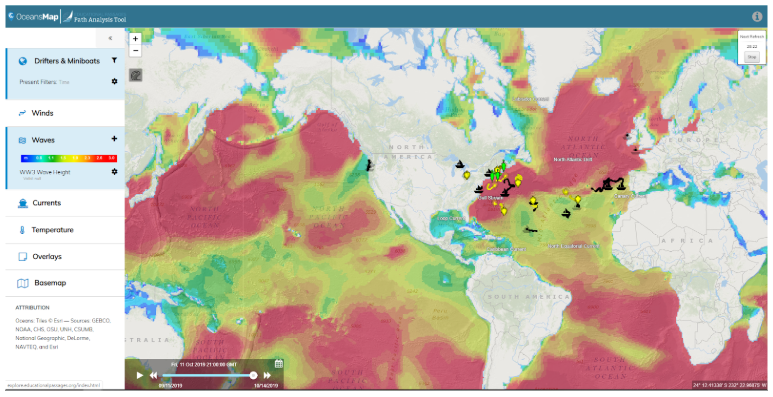
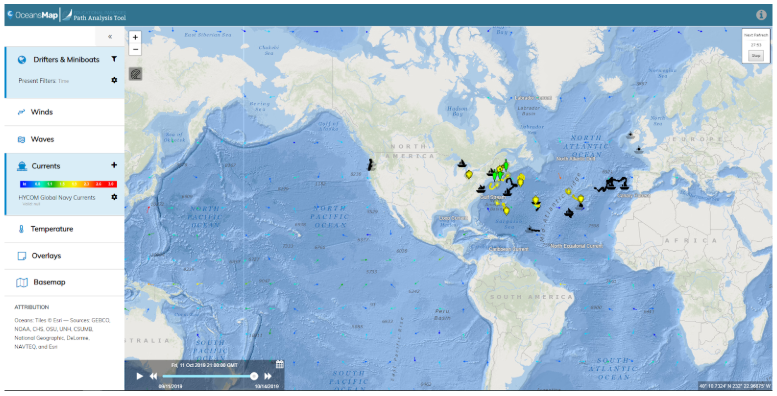
When you first visit the tool at explore.educationalpassages.org from a desktop computer, the screen should look similar to the image below. From here you can move the map base by clicking anywhere and dragging it to the side. You can also zoom in and out.
![]()
Icons
You will see a few different icons on the map as they represent different vessel types. The icon legend is shown to the right and will be described further in this guide.
Layers
On the left of the tool, you will see a menu of items you can add as layers such as Drifter and Miniboat tracks (“Drifters and Miniboats” which is the vessel selector), Winds, Waves, Currents, or Temperature. Some of these layers have adjustable settings. For example, the wind layer has both vector and streamflow displays.
You will also see options for Overlays and Basemap. We will describe these later in this guide.
Information popup
To see the information at each point, click on an icon or dot along the track and a popup window will show like the image on the right here.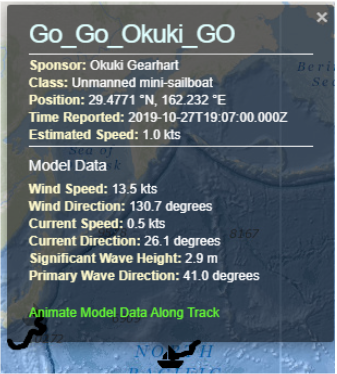
The information about the vessel for the point you selected is displayed at the top with:
- Name,
- Sponsor,
- Class,
- Position,
- Time reported, and
- Estimated speed (which is a calculation based on the last two positions)
The Model Data section is derived from model data in the tool and shows estimates at that point of:
- Wind Speed,
- Wind Direction,
- Current Speed,
- Current Direction,
- Significant Wave Height, and
- Primary Wave Direction
From the popup window, you can animate the information along the path (desktop only). We will explain this later in the guide. Click on the “x” in the top right corner to go back to the map.
Mobile access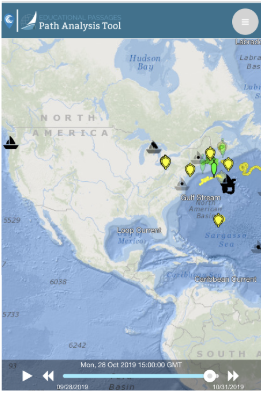
The tool can also be used on a mobile device. When doing so, the main screen will look something like the image on the right. There are a couple things that are not available in the mobile version but are on the desktop: animate data along track, change search timeframe, and use the ruler tool.
You can select on any icon or point just as above, but to see the menu options you will need to click the icon on the top right.
Adding a layer to the map
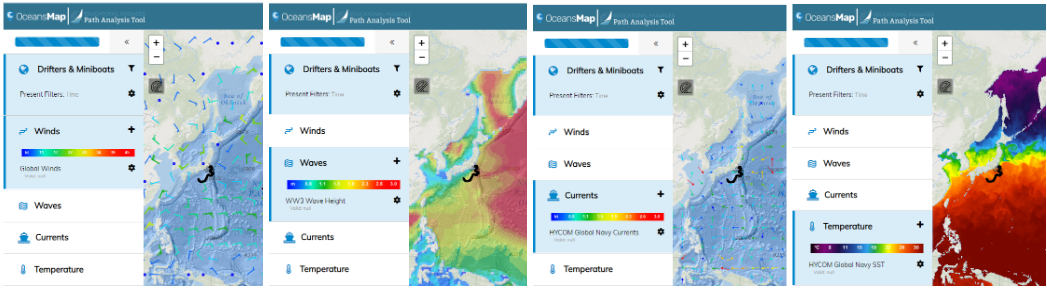
Click the layer you’d like to see from the table of contents menu (options: Winds, Waves, Currents, Temperature). Each item has an icon that will show data sources , and one which can be used to update layer settings.


Adding a layer to the map – Winds

 To see wind vectors from Global Winds, click on the “Winds” tab from the menu. It will turn blue when selected (as shown on the right). There is only one source for winds at this time. Click on the layer from the menu again to deselect it.
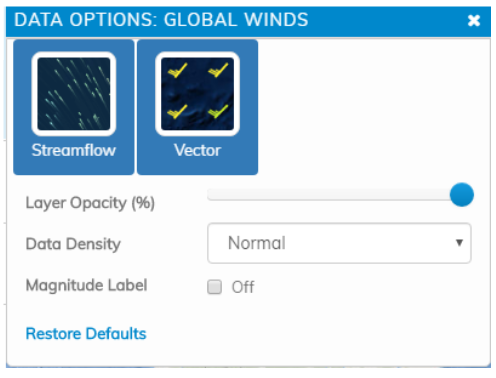
To see streamflow instead of vectors, select the cog settings icon and select streamflow under data options as shown:
Adding a layer to the map – Waves
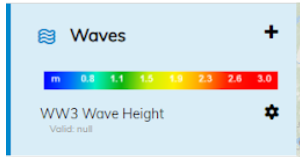
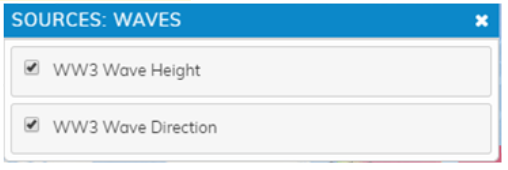
 To see waves from WW3 Wave Height, click on the “Waves” tab from the menu. It will turn blue when selected (as shown on the right). Click on the layer from the menu again to deselect it.
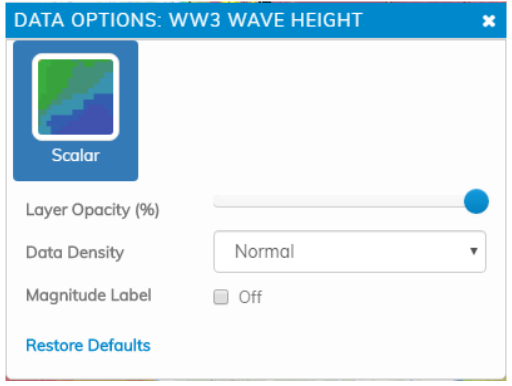
To see wave direction arrows over height, select the “+” icon and select WW3 Wave Direction under sources as shown:
To see the data options, click on the cog settings icon.
Adding a layer to the map – Currents
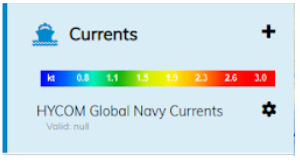
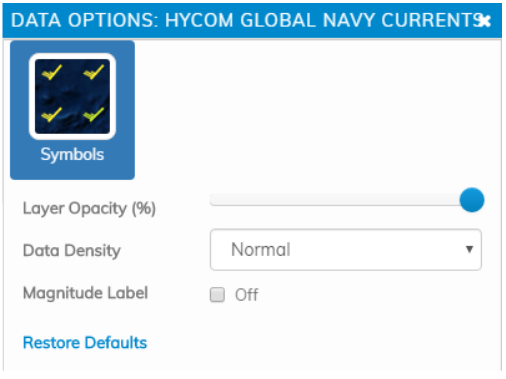
 To see current vectors from HYCOM Global Navy Currents, click on the “Currents” tab from the menu. It will turn blue when selected (as shown on the right). There is only one source for currents at this time.
You may need to zoom in on the area of interest to see the layer better.
Click on the layer from the menu again to deselect it.
To see the data options, click on the cog settings icon.
Adding a layer to the map – Currents
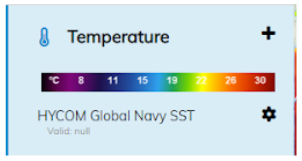
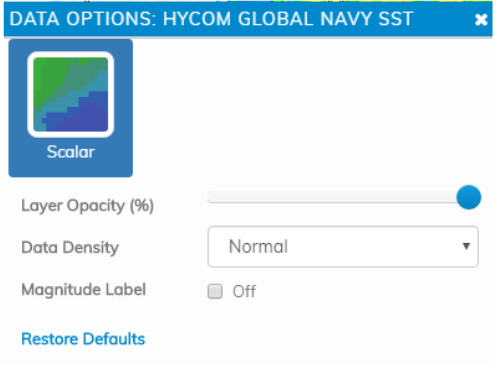
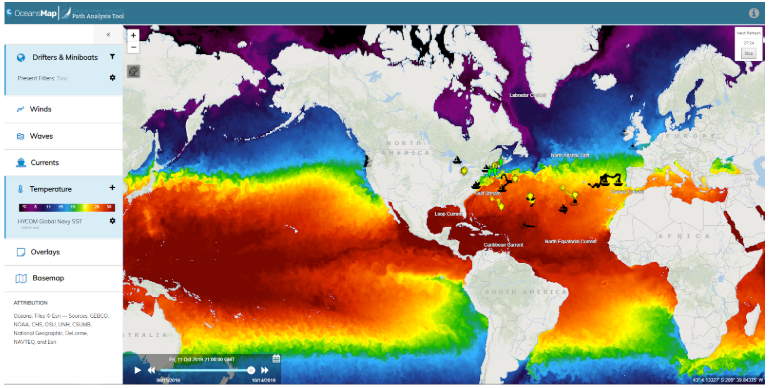 To see temperature from HYCOM Global Navy SST, click on the “Temperature” tab from the menu. It will turn blue when selected (as shown on the right). There is only one source for temperature at this time. Click on the layer from the menu again to deselect it.
To see the data options, click on the cog settings icon.
Using the drifter filter tool

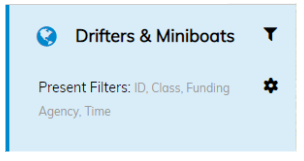 Click the filter icon from the “Drifters & Miniboats” in the menu.
A popup screen labeled “DATA FILTER” should appear. The filter options here are: Name, Class, Funding Agency. Name is the drifter or miniboat name, Class is the type of drifter (standard, drogue, etc) or miniboat, and Funding Agency is the school or sponsor.
Display one type of drifter or miniboat
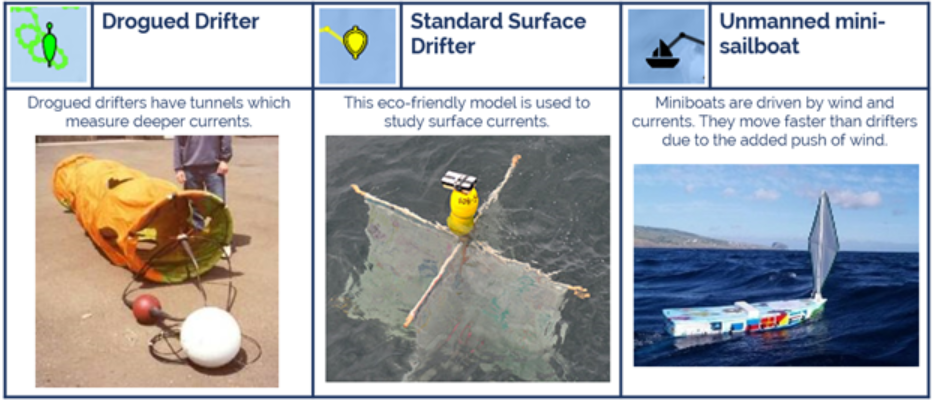
Class is how we categorize the types of drifters and miniboats in the tool. The three main types are:
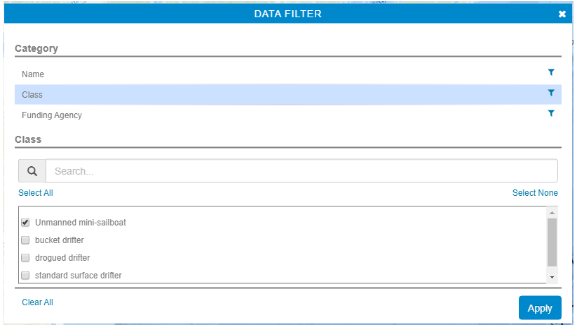 To show only one class, click “Class” from under the “Category” heading. From the menu that shows, deselect the types you do not want to see, leaving the one(s) that you do.
You can also click “select none” from under the search bar, and then check the box to select the one that you do want.
Click “Apply” to see changes applied. The example below should show only Unmanned mini-sailboats on the map (black sailboat icons).
*General note – Items returned by this filter have to be true across each category. What this means is that if you had unselected all of the items under the “Name” category then no results will come back. So if you are having trouble, either refresh the tool or check the other filters and make sure that all are selected.
Find and select your miniboat or drifter
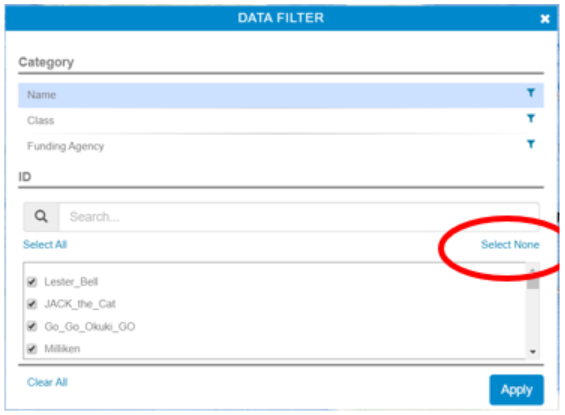 To find and select one or more tracks to display, select “Name” from the “Category”. Click “Select None” as shown below from under the search bar on the DATA FILTER menu.
Then search for your drifter by name by typing the name, or scrolling in the list. Once found, select it, and click the blue Apply button.
If you don’t see it on the list, you may need to adjust the search timeframe.
Adjusting the search timeframe
The tool only displays the last 30 days of tracks. If your drifter or miniboat was at sea beyond that timeframe you will need to adjust the calendar.
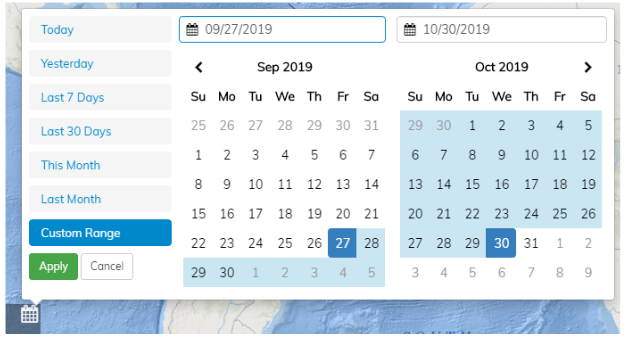
 To do this, click on the calendar icon from the bottom left of the tool which is positioned to the right of the menu. It should look like the image here:
To change the timeframe that the tool will search through, enter the dates of interest, and click Apply. The tool will now use the dates of interest in searching.
Disable ocean current labels
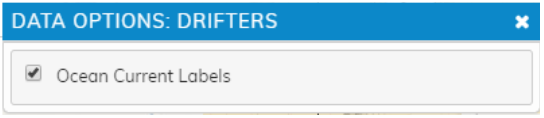
To disable the ocean current labels in the Atlantic, select “Drifters & Miniboats” from the menu, and click the cog settings icon. Uncheck “Ocean Current Labels”.
Adding additional overlays
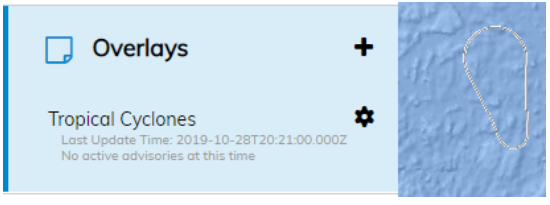
Click “Overlays” from the menu on the left. Click on the “+” icon to add the layer and click on the cog settings icon next to the layer to update layer settings. Tropical cyclones is currently the only overlay available. An example of a tropical cyclone overlay is shown to the right.
Switching basemaps
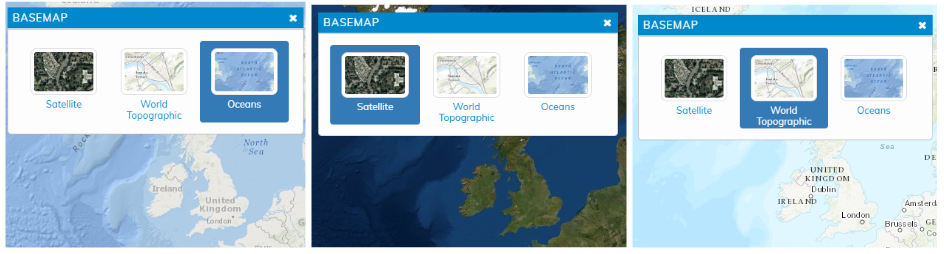
You can change the basemap for the tool but selecting “Basemap” from the menu on the left. A panel will open and show 3 options you can select from: Satellite, World Topographic, and Oceans (default).
Other functions – Animate tracks
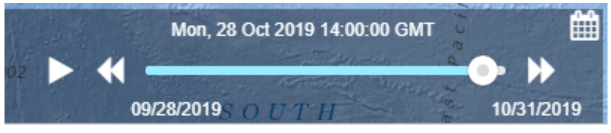
From the popup menu referenced above, click on the green link at the bottom that reads “Animate Model Data Along Track”, and a bar will show up on the bottom of the tool like this:

To see the animation, click on the play icon from the time slider, and watch the information in the bubbles change as the track moves over time:

Other functions – Measure distance

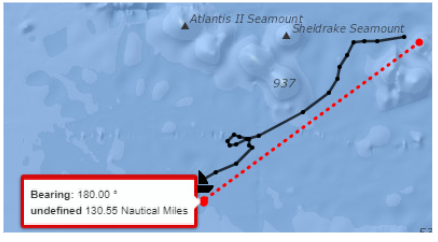 Use the route measurement tool (shown here on the left) that is next to the menu on the tool to measure distance between two points. Click on the icon, select your first point, and then your second and the calculation will appear. Note that you cannot click the same spot where there are icons so click next to it. The route measurement tool can be stopped by double clicking on the map (this stops the measurement) followed by clicking on the protractor icon.